DayPilot
How to do totals by column and conditional coloring of cells
8 months ago.
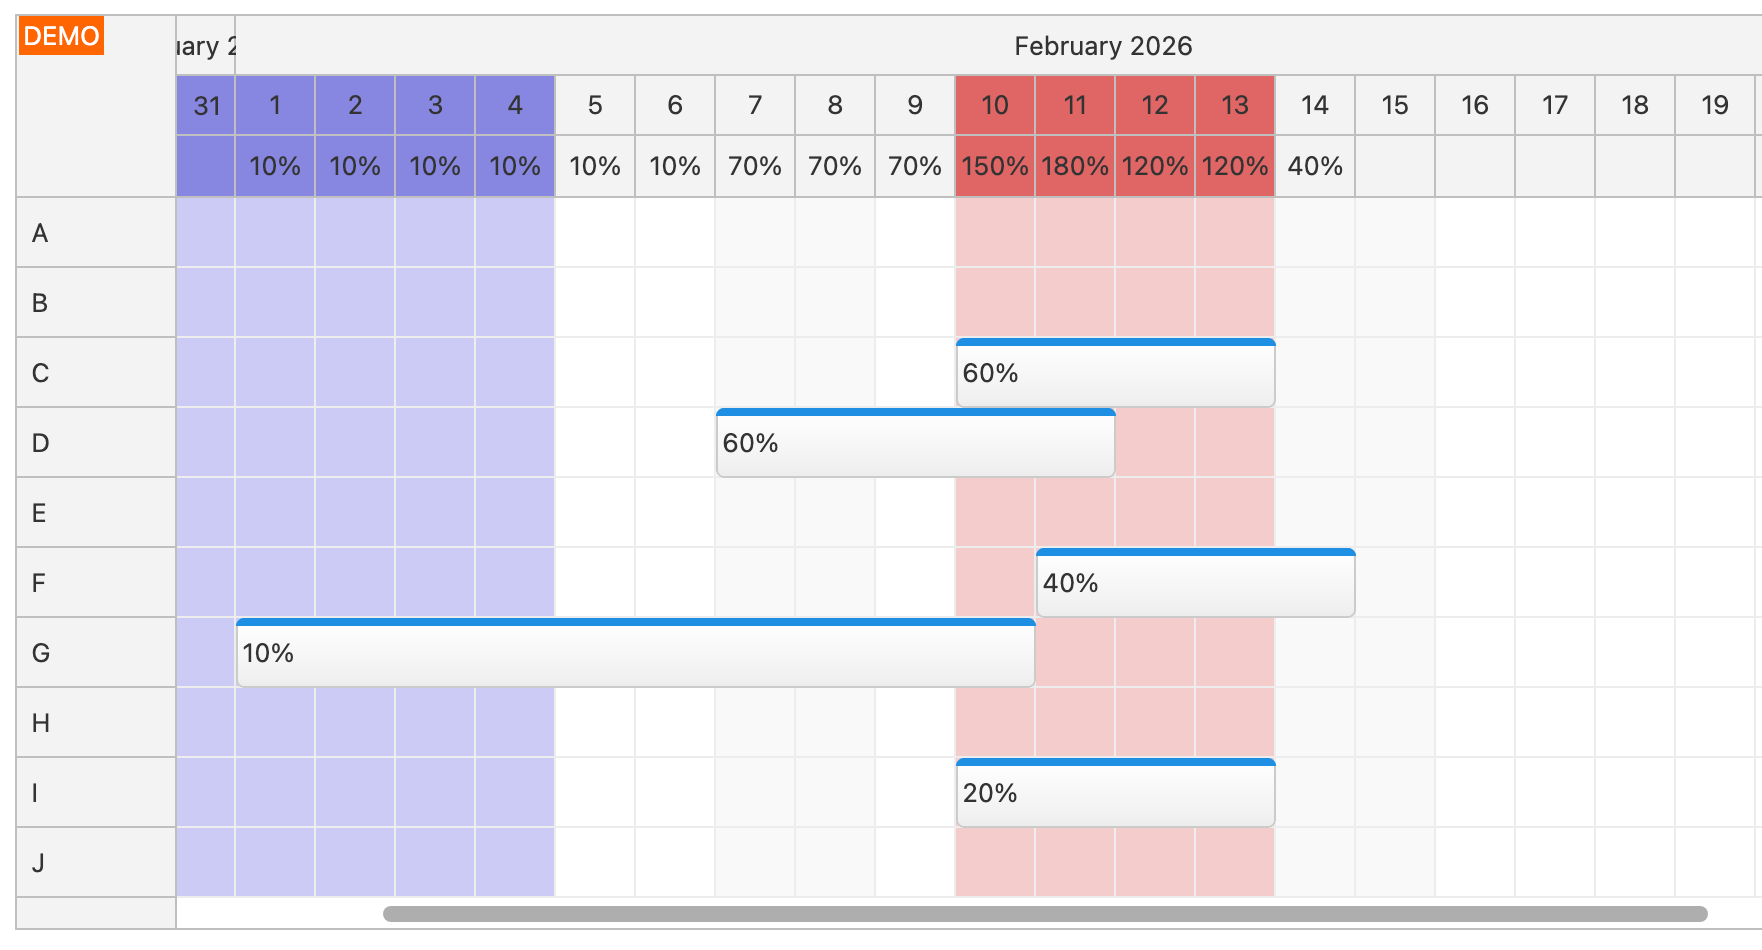
In my application each event has as weight of sorts (think of it as a percentage), and I want to show the totals-by-column. If the total exceeds 100% I want to color it red. I got quite far but I have some loose ends, and I worry I may have the wrong approach.
Here’s what it looks like (ignore the blue columns, that’s something else.)
What I’m trying:
-
I store the event weight in
event.tags.weight -
In various places like
onEventMovedoronTimeRangeSelectedI call arecomputeWeights()function -
My
recomputeWeights()function iterates through all columns. I didn’t find a direct way to iterate the columns, but I’m doingfor (cell of rows.find(“1”).cells.all())
where row 1 is just a representative row, and that works well enough -
I use
events.forRange(cell.start, cell.end)to find all the events in that column, and add up the weights from the tags -
I store that in a simple weights object where the key is
cell.startand the value is the weight -
Then, in onBeforeTimeHeaderRender and onBeforeCellRender I can look up the weight by cell-start in my weights object
A few things are not yet working, or feel icky:
-
When you drag to create a new event, I call
events.add(), and thenrecomputeWeights(), but the new event isn’t present yet (race condition) so it doesn’t update correctly -
I haven’t found where to compute the weights on first open
-
I have to “prod” the Scheduler to repaint the headers. I’m doing:
dp.update({timeHeaders: [{"groupBy":"Month"},{"groupBy":"Day","format":"d"},{"groupBy":"Day","format":"d"}],});Which isn’t changing the timeHeaders, just asking them to get redrawn.
Is there a better approach for any of this?